Water Emission Inventory Support System
WEISS is an in-house developed software based on underlying spatial models that map and model emissions to surface water.
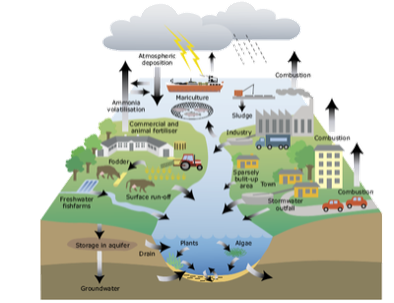
In a first step, sources that emit pollutants are inventoried and mapped, with associated data or estimates of their quantities. Both point sources with their exact locations and more diffuse sources of pollution, such as atmospheric deposition or the use of plant protection products, can be included in the WEISS tool. In a second step, WEISS models in a spatially explicit manner the transport routes followed by the pollutants from the emission source to the surface water. Finally, all emissions come together in total maps per source or group of sources, per substance or group of substances, per node or group of nodes of the transport routes, per grid cell or group of grid cells such as administrative and hydrological areas, ....
Why using WEISS?
WEISS provides answers to policy relevant questions such as:
• Which sources of pollution are responsible for the observed water quality in river segment x and what is the contribution of each source?
• How have the total emissions and the contribution from the various emission sources evolved over the years?
• How much of the pollution actually ends up in the surface water?
• What share of the pollution comes through the urban wastewater treatment plants? How much through the sewer system that is not yet connected to an active treatment plant? How much via the non-sewage areas? And how much via surface runoff?
• What is the effect of specific sewerage measures on the amount of emissions?
• Where is the investment in additional urban wastewater treatment plants most effective?
• In which areas should additional research be carried out into unknown emission sources?
• …
WEISS can be applied to areas of different size: from industrial or rural sub-areas to entire EU Member States, but also from small sub-catchments to large transnational river basins. But, most importantly, WEISS can be applied in data rich as well as data poor conditions. To the effect, it is equipped with a set of algorithms that can be applied under all circumstances. WEISS applications can thus start-up as fairly simple and coarse applications but evolve rapidly as new or better data become available.
We deploy WEISS both as a product and as a service. Parties with a repetitive demand and a desire to perform the recurring analyses themselves can use WEISS as a product, guided by a customised training. Parties with a demand for exploratory and research-oriented analyses and scenarios can use WEISS as an input model in the framework of a service provided by VITO.
Where it began
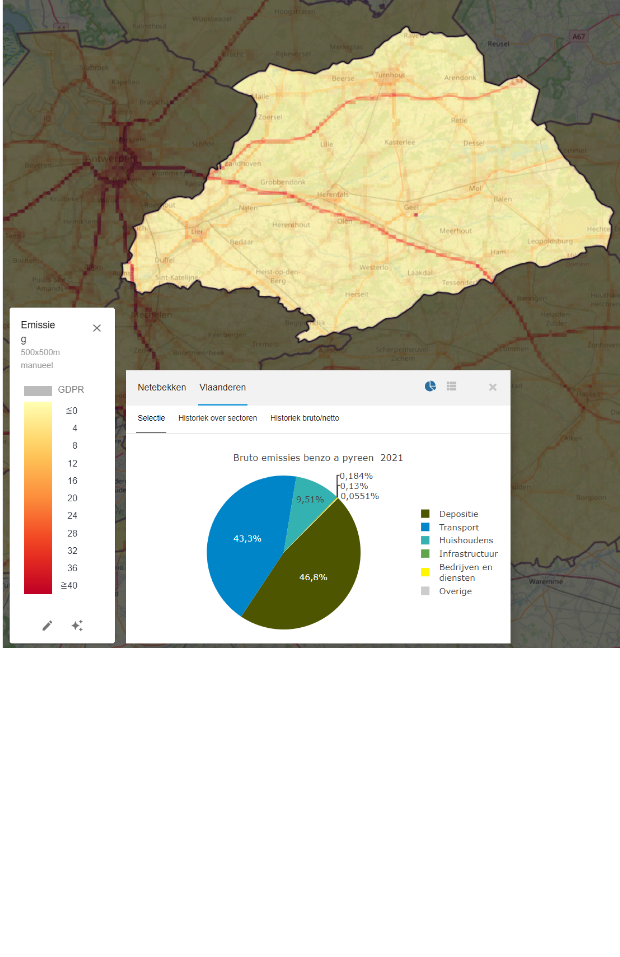
The first version of the WEISS tool was developed by VITO during the EU-Life+ project ‘WEISS’ in collaboration with VMM in the period 2010-2012. Since then it has been used by VMM and is continuously updated and upgraded as part of its inventory and reporting tasks. In addition, the WEISS results are also used for for water quality modelling. VITO provides support for further software development and for content related innovations. VMM’s WEISS tool represents the entire Flemish region of Belgium, covering some 13.500 km², at a resolution of 50 by 50m. It currently contains information on about 80 substances (heavy metals, PAH, pharmaceuticals, plant protection products, etc.), about 120 diffuse sources and about 1,500 point sources. Since 2010, a new emission inventory has been made for each year, filled with the most recent data possible. The most important results can be consulted in the WEISS viewer.