Emission Inventory Support System for Air
EISSA is an in-house developed software based on underlying spatial models that map and model emissions to air. Emission maps can be created in EISSA in 3 ways: bottom-up, top-down or directly entered as an existing emission map.
In the bottom-up approach, EISSA developes emission maps based on a basic formula stating that the gross emission of a substance is the product of an emission explanatory variable and an emission factor.
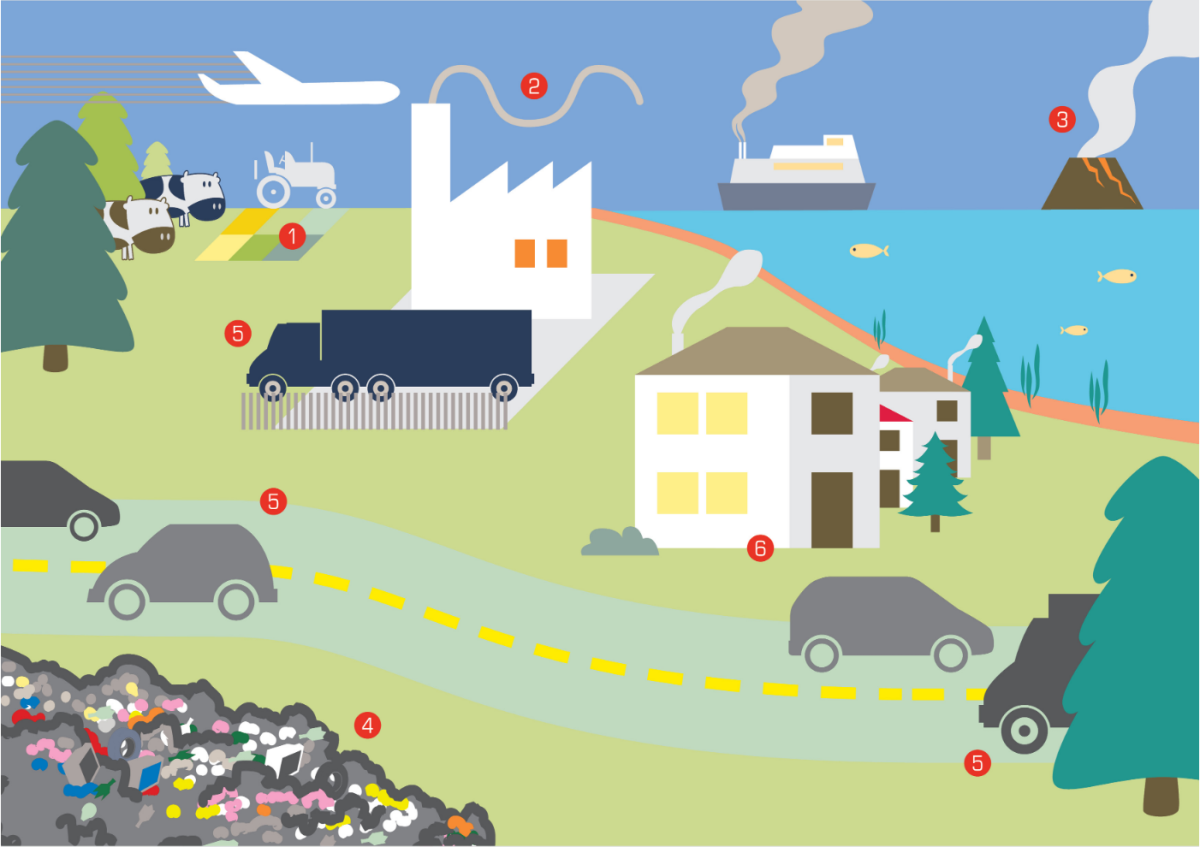
The emission explanatory variable is the physical activity or the physical element that causes the emission. Examples are the amount of kilometers driven by a vehicle of a specific vehicle type, the amount of specific fuel, e.g. solid, liquid or gaseous fuel, used for residential heating. The emission explanatory variables are generally represented in a spatially explicit manner. They are spatial patterns showing the occurrences of the sources. EISSA is supporting the user to generate these kind of maps.
The emission factors represent the quantity of substance that is annually released per unit of the emission explanatory variable. For example, there is an emission factor that represents the amount of emissions released per driven kilometer and another one specifying the amount of emissions per unit of combusted fuel. In EISSA, emission factors may also have a spatial dimension.
Literature study or new scientific research is required to define both parameters per source-substance combination. EISSA supports the factual use of this scientific knowledge in policy-making by automating the necessary calculations.
In the top-down approach, regional emission figures will be given a spatial translation by drawing up the matching spatial pattern of the emission source in EISSA. A set of spatial algorithms are available for this purpose, so that the available data sources can be used optimally.
In addition, it is also possible to integrate specific calculation modules into the EISSA framework when more detailed emission calculations are required. We are thinking here, for example, of emissions generated by the heating of buildings, where the calculations must take into account the ever-evolving building stock.
Why using EISSA?
EISSA assists in designing and implementing targeted reduction and phasing out emission related measures. It enables to:
• analyze emission trends and other indicators over time, also in the future
• identify gaps in knowledge and define the need to carry out studies/campaigns or develop strategies/policies
• investigate the impact of specific measures on emissions. Examples are the reduction of (traffic) emissions due to implementing a low emission zone, applying a congestion charge, a renewal of the car fleet, encouraging modal shifts, etc.; the reduction of (residential) emissions due to discouraging/banning wood burning; the reduction of (industrial) emissions due to more stringent Directives; etc.
EISSA, in combination with air quality models, provides answers to the policy relevant questions with respect to air quality, such as:
• Which sources of pollution are responsible for the observed air quality and what is the contribution of each source?
• How much of the pollution is due to local emissions, and how much is imported from elsewhere?
• How does air quality evolve over the years?
• Which are the most effective measures to improve air quality?
• …
EISSA can be deployed for large and small regions, operates at the level of detail and resolution determined by the user and it allows the user to decide on the sources and substances to be included in the system. EISSA can save data for different moments in time, hence it can also calculate and visualize trends in emissions.
